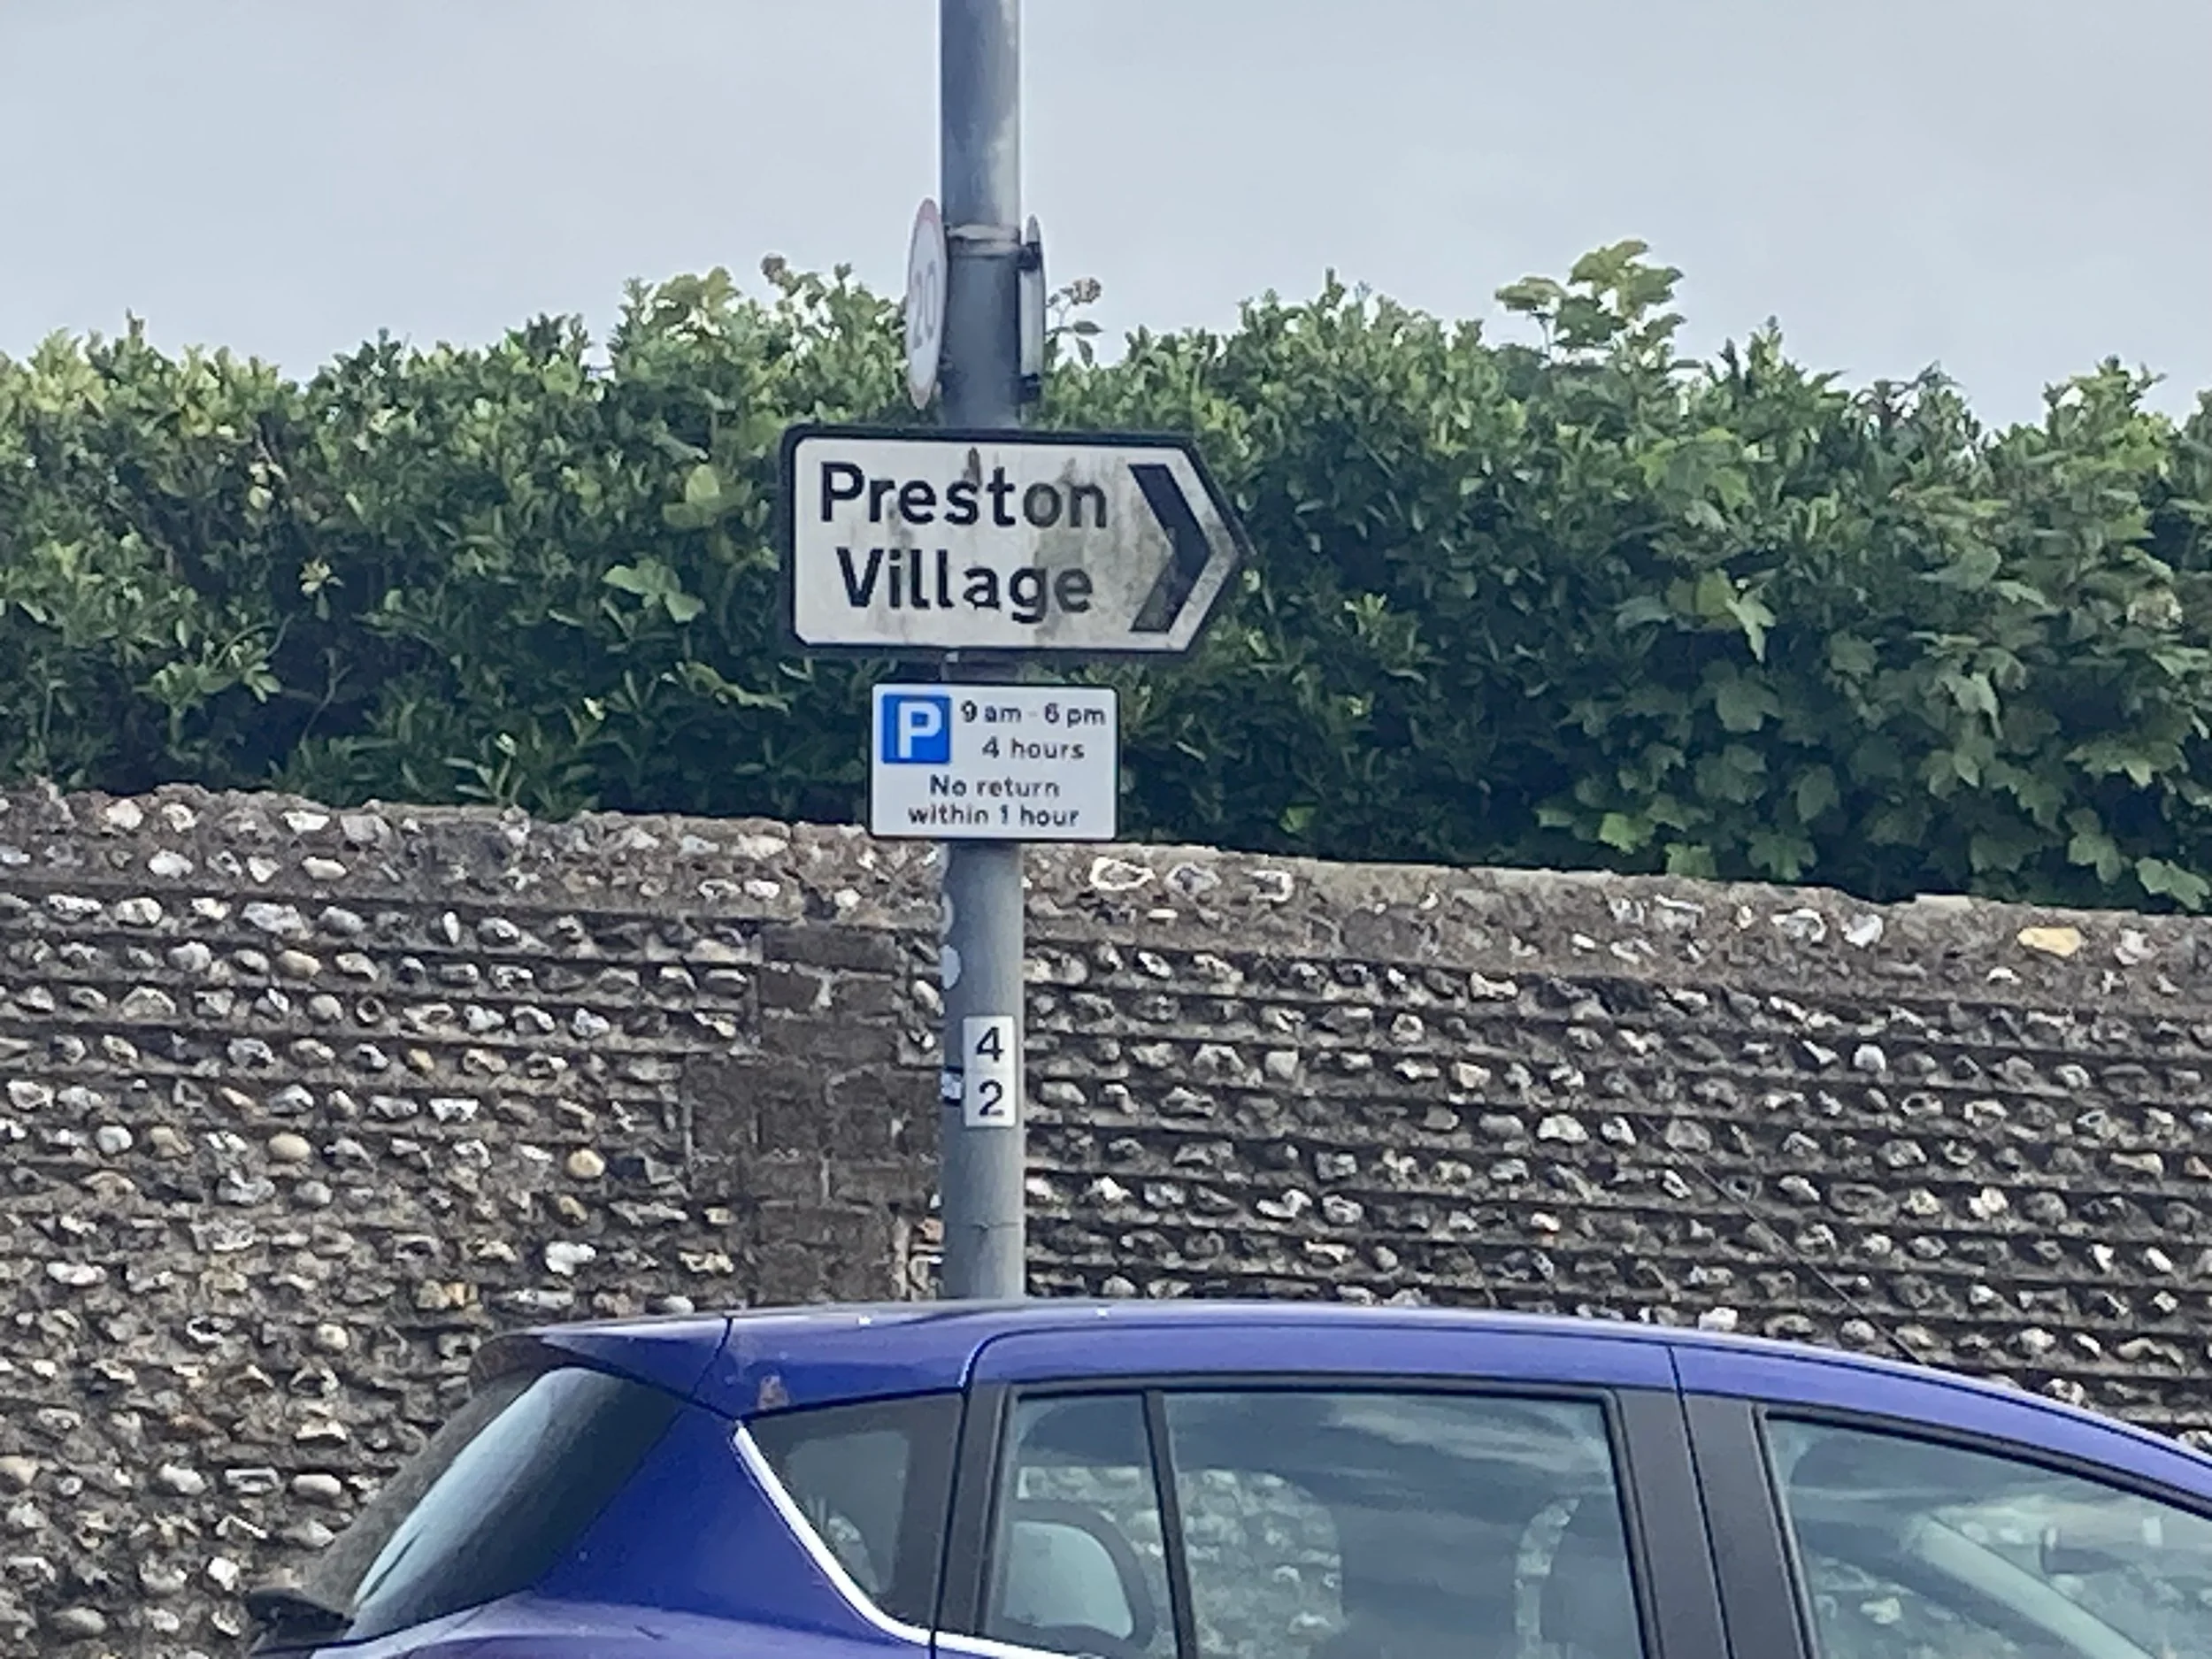
Preston Village was once an independent East Sussex village but is now part of the City of Brighton & Hove.
The village is on the A23, adjacent to Preston Park between Brighton & Patcham, the primary north / south transport corridor into the city.
In the 1930's the road through Preston Village was widened to allow space for local traffic and through traffic to Brighton.
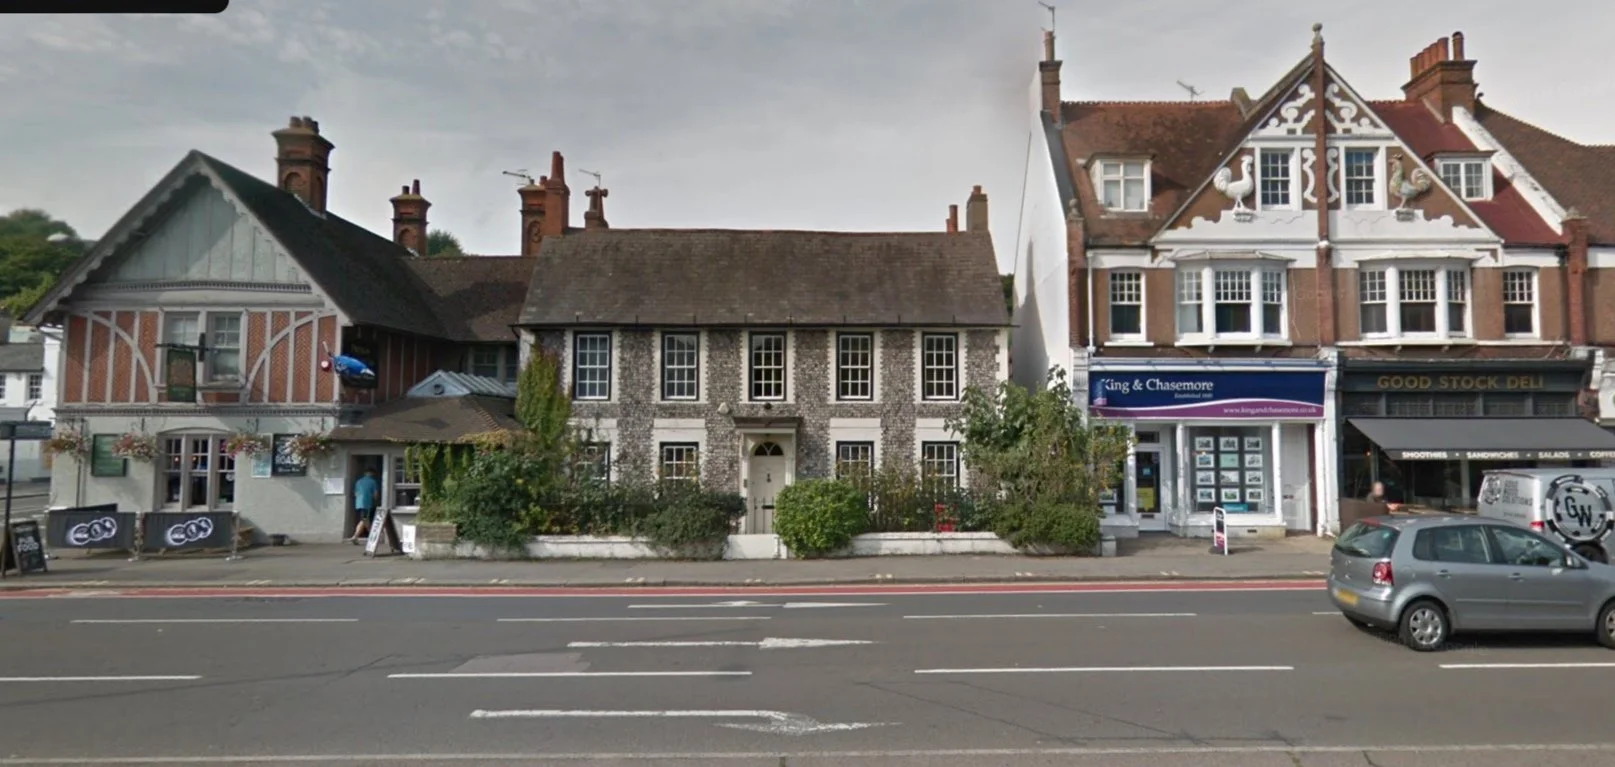
Subsequent changes to road layout, traffic volume and traffic speed have over-run the village. At points the carriageway in front of Preston Village is now double the width of other locations to the North & South.
Traffic engineers and urban planners have determined that the 6 lane carriageway provides very limited capacity increase or improvements to traffic flow or journey times.
Moreover, in its present state the A23 generates a ranges of problems which disproportionately impact the local community including;
- An unattractive environment for pedestrians and wheelchair users, due to motor vehicle volume, speed and proximity.
- Large impermeable surface areas which exacerbate flooding
- Air pollution from brake particulate, engine exhaust particulate and tyre particulate matter.
- Serious noise pollution
- A poor record of road traffic accidents, exacerbated by a road layout which perpetuates driver conflict.
- Very restricted pedestrian space.
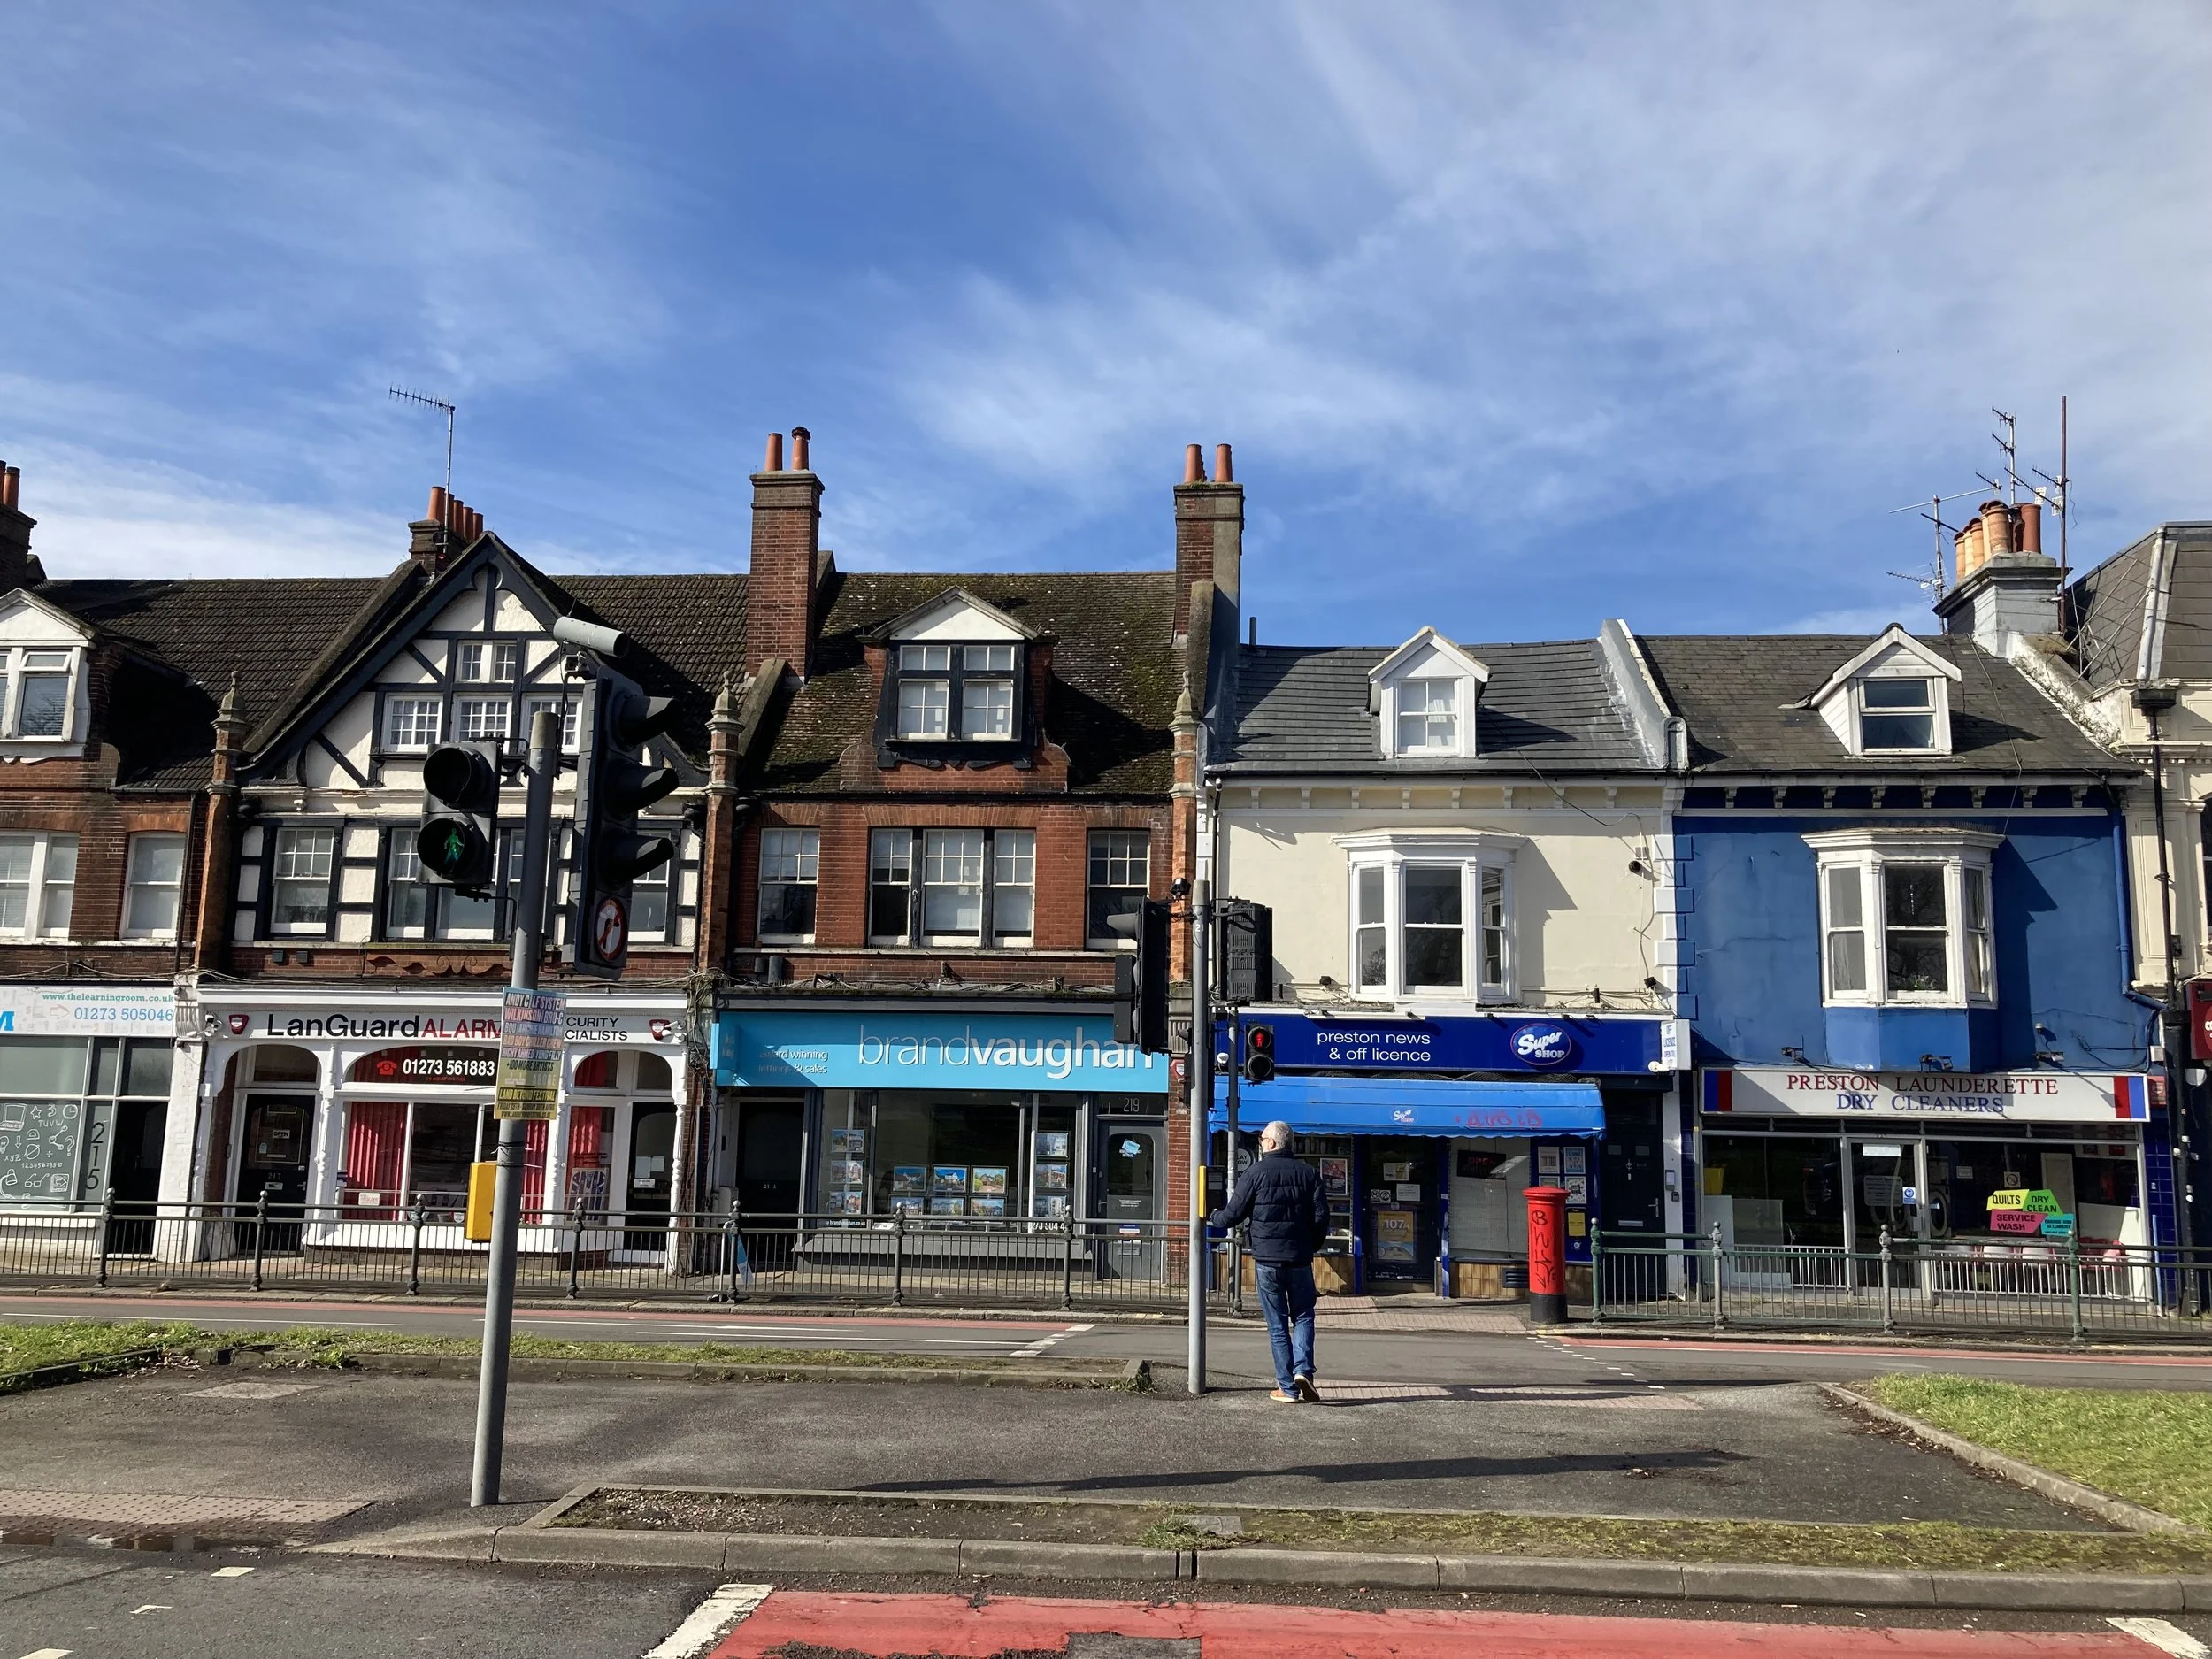
- Very restricted space for business in front of shops
- Poor bus stop locations which prevent access to local shops
- Poor road crossings which prioritise motor vehicles
- Unsafe cycle lanes
- Limited parking and loading which directly impact small local businesses.
In order to Renew Preston Village as a thriving, walkable, people centred community, we are campaigning for changes to the road layout which makes space for, and creates opportunities for, improvements in public realm, air and noise pollution, local economy, flood mitigation and accidents involving motor vehicles.
Measures should include but are not limited to;
1. Better crossings & more space for people walking & wheeling
2. Rain Gardens & Street trees to mitigate flooding
3. Parking & loading bays for easy access to shops
4. Bus stops in the village, closer to the shops and pubs
5. Protected space for people cycling
The measures and solutions proposed by Renew Preston Village are supported by a range of research studies and policy papers from the UK Gov Department for Transport, Brighton & Hove Council and a range of Non-Governmental Organisations including Living Streets, Active Travel England, Create Streets, Cycling UK, Sustrans and South Downs National Park Authority et al.
Source materials and evidence for specific claims are supported below.
the environment and public realm on the A23 at Preston Village is unattractive for pedestrians and wheelchair users, due to motor vehicle volume, speed and proximity
Study: The Impact of Vehicle Speed on Pedestrian Safety and Walkability (2008) by Richards, D.C. (TRL Report PPR 440)
Findings: Higher vehicle speeds significantly increase the risk of severe injury or death for pedestrians. Walkability and perceived safety drop when vehicle speeds exceed 20 mph.
Quantitative Data: Pedestrian fatality risk increases from 10% at 20 mph to 80% at 40 mph.
Source: Gear Change: A Bold Vision for Walking and Cycling (UK Department for Transport, 2020)
Findings: Streets with reduced traffic volumes and lower speeds report higher pedestrian satisfaction by 68% in pilot projects.
Source: Manual for Streets (UK Department for Transport and Communities and Local Government, 2007)
Findings: Streets with lower vehicle speeds (below 20 mph) and higher pedestrian priority contribute to a safer and more attractive environment for pedestrians.
Large Impermeable Surface Areas in Preston Village Exacerbate Flooding
Study: Surface Impermeability and Urban Flooding: Case Studies in England (2019), Journal of Hydrology
Findings: Urban areas with over 70% impermeable surfaces experience floodwater runoff rates 1.5–3 times higher than areas with integrated green infrastructure.
Source: Greener Streets: Climate Adaptation and Sustainable Drainage Systems (Sustrans, 2020)
Quantitative Data: Rain gardens and street trees can reduce stormwater runoff by up to 90% during small rain events and 30% during large storms.
Study: The Role of Sustainable Urban Drainage Systems (SuDS) in Reducing Flooding Risks (2017), Building Research Establishment (BRE)
Findings: Incorporating SuDS in urban planning can reduce surface water flooding by up to 40%.
Air Pollution from brake particulate, engine exhaust particulate, and tyre particulate matter
Study: Non-Exhaust Emissions from Road Traffic (2019), DEFRA
Findings: Non-exhaust emissions (brake, tyre, and road wear) contribute to 55% of PM10 and 45% of PM2.5 pollution on urban roads.
Quantitative Data: These pollutants remain constant regardless of engine type, including electric vehicles.
Source: Global Ambient Air Pollution Update (WHO, 2018)
Findings: PM2.5 levels above 10 µg/m³ are linked to increased respiratory and cardiovascular diseases.
Source: The Economic and Health Impact of Air Pollution in the UK (DEFRA, 2020)
Findings: Road transport is responsible for 38% of total PM10 emissions in urban areas.
Levels of Noise Pollution are the worst in Brighton & Hove
Study: Environmental Noise and Health in the UK (2014), DEFRA
Findings: Noise levels exceeding 55 dB are linked to increased risk of hypertension, sleep disturbance, and mental health issues.
Quantitative Data: Areas with heavy traffic see noise levels routinely exceed 70 dB during peak hours.
Source: Transport Noise and Public Health (WHO, 2018)
Findings: Long-term exposure to transport-related noise increases the risk of heart disease, stroke, and poor sleep quality.
Source: Brighton & Hove Noise Action Plan (2019)
Quantitative Data: Noise pollution along the A23 corridor is among the highest in residential areas of Brighton and Hove.
the A23 at Preston Village has a poor record of road traffic accidents, exacerbated by a road layout which perpetuates driver conflict
Study: Road Safety Risk Factors and Infrastructure Design (2016), European Transport Safety Council
Findings: Complex layouts with high-speed merges increase crash rates by 37%.
Source: CrashMap UK Data (2023)
Quantitative Data: The A23 dual carriageway section has a higher-than-average accident rate compared to similar urban roads.
Study: Accident Rate in Urban Roads: Implications for Road Design (2020), Road Safety Research Journal
Findings: Roads with high-speed dual carriageways and merging lanes see an average 25% increase in accident rates compared to single-lane roads with fewer junctions.
Pedestrian Space is Very Restricted
Study: Impacts of Sidewalk Width on Pedestrian Flow and Safety (2018), Transportation Research Part F
Findings: Pedestrian safety and comfort decline when footpaths are narrower than 2.0 meters, especially in areas with high traffic volumes.
Quantitative Data: Narrow footpaths reduce effective pedestrian flow rates by 30%.
Source: Living Streets – The Case for Walkable Cities (2018)
Findings: Cities with wider pedestrian pathways have 20% higher pedestrian traffic and 15% higher footfall for retail businesses.
Space for Business in Front of Shops is very restricted
Study: Economic Benefits of Walkable Streets (2015), Journal of Urban Economics
Findings: Retail revenue increases by 20–30% in areas where pedestrian spaces are expanded, and vehicle access is restricted.
Source: Making Streets Work for Business (Living Streets, 2020)
Quantitative Data: Survey data from over 100 UK towns show businesses reporting a 25% increase in footfall after street improvements.
Study: Impact of Urban Street Design on Small Business Performance (2019), Transport Policy Journal
Findings: Restricting vehicle traffic and creating pedestrian-friendly zones resulted in 22% higher retail sales in pilot cities.
Poor bus stop and bad crossing locations prevent access to local shops
Study: Public Transport Accessibility and Urban Land Use (2017), Journal of Transport Geography
Findings: Bus stops located more than 300 meters from shops reduce access for 60% of users with limited mobility.
Quantitative Data: Relocating bus stops nearer to shopping hubs increased public transport usage by 15%.
Source: National Bus Strategy (2021), Department for Transport
Findings: Accessible bus stop locations result in a 20% increase in shopping trips by public transport users.
Poor Road Crossings Prioritise Motor Vehicles
Study: Pedestrian Crossings: Safety and Usability (2016), Transport Research Laboratory
Findings: Zebra crossings and raised tables reduce pedestrian injury rates by 40%.
Source: Manual for Streets (UK Department for Transport, 2007)
Findings: Raised crossings and reduced vehicle priority are associated with 25% fewer pedestrian accidents.
Source: Brighton & Hove Local Cycling and Walking Infrastructure Plan (LCWIP) (2022)
Quantitative Data: The lack of pedestrian-prioritised crossings on the A23 is identified as a critical barrier to walking and cycling.
Unsafe Cycle Lanes
Study: The Safety of Segregated Cycling Infrastructure (2021), Cycling UK
Findings: Protected cycle lanes reduce collision rates by 50% compared to unprotected lanes.
Source: The Cycling Infrastructure Safety Evaluation (Sustrans, 2020)
Quantitative Data: Cities with segregated cycle lanes saw a 25% increase in cycling participation and a 30% decrease in accidents involving cyclists.
Source: Brighton & Hove LCWIP (2022)
Quantitative Data: The A23 section has an incomplete cycle network, which deters cycling, contributing to a lack of safe options for cyclists.
Limited Parking and Loading Which Directly Impact Small Local Businesses
Study: Parking Policy and Retail Success (2013), Journal of Transport Policy
Findings: Poorly planned parking and loading zones lead to a 15% decrease in retail sales, especially for smaller businesses.
Source: Streets for Local Economies (Create Streets, 2019)
Quantitative Data: Access to short-term parking and loading zones increases customer access by 20%.
Study: Economic Effects of Urban Parking Management (2015), Urban Studies Journal
Findings: Improving loading and parking facilities led to a 12% increase in business revenue in urban retail areas.
Key Research & Source studies
Brighton & Hove City Council's Local Cycling and Walking Infrastructure Plan (LCWIP): BHCC’s strategy for developing walking and cycling networks.
Brighton & Hove City Plan Part One and Part Two: Core documents outlining the city's transport and infrastructure policies to promote sustainable travel.
Sussex Local Transport Plan: A regional strategy setting transport goals, including walking and cycling improvements which align with Renew Preston Village project outcomes.
Transport for South East’s Transport Strategy: Includes objectives for sustainable travel that align with Renew Preston Village cycling and walking projects.
Brighton & Hove's Air Quality Action Plan
Brighton & Hove City Council's Sustainability Action Plan
South Downs National Park Authority's Local Plan
Community and Non-Governmental Studies
Create Streets Foundation - "Streets for Everyone": Guidelines for creating people-friendly streets that prioritize walking and cycling consistent with the objectives of Renew Preston Village.
Living Streets - "Blueprint for Change": Advocacy document supporting pedestrian-friendly streets.
Cycling UK - "Space for Cycling” You get the picture here!
Sustrans - "Paths for Everyone": A report advocating traffic-free paths for all users.
Create Streets - "Soft Infrastructure": Discusses greenery, street furniture, and urban design that encourage active travel.
Healthy Homes: Healthy Places by Create Streets: A study which links urban design with health and active lifestyles, supporting community-centered infrastructure
Moving Towards Growth: why it’s time to build on Britain’s Roadbelt. A he economic cost of roads and the value of streets.